1 Dashboard
1.1 Overview
The dashboard service will provide an interactive web front end that can be used for the display and visualisation of geospatial and tabular data ingested from web services following common interoperable protocols (e.g. OGC Standards; STAC etc). The service will be data-driven, allowing administrators to define the configuration of a dashboard in JSON ( i.e. the data layers and functional operations possible for each layer). This configuration will determine how the user interface is rendered at run time and the resulting data and functionality that is exposed to the end user of the dashboard.
Typical functions will include the ability to visualise EO data, derived products and associated vector layers (e.g. administrative boundaries), with control over layer ordering, transparency, product comparisons (split screen) and support for features such as cursor inspection, queries, distance measurements and visualisation of tabular data via integrated charts and graphs. The UI will also provide access to metadata records associated with the data that is rendered in the dashboard service.
1.2 Showcase Scenarios
The showcase scenarios for dashboards will target both project and SEF use cases.
Project teams will be able to configure dashboards with data outputs from project work to support the dissemination of project outcomes to project team members, ESA stakeholders and wider interest groups. The dashboards will be a key tool that ensures the sustainability of project deliverables beyond the lifetime of the project.
The SEF team will be able to configure dashboards to support the wider promotion of ESA work to policymakers and end users, with the expectation that dashboards will be used at events such as trade shows, conferences and workshops. It is expected that dashboards will be configured around specific “narratives” within overarching SEF “themes”, such that the SEF team have a collection of dashboards that can be taken to different events for demonstration.
Based on the analysis of various existing ESA and independent third-party dashboards, it is proposed that there are three levels of dashboard capability, as outlined in the following sections. It is important to note that these levels should not be seen as separate entities; functionalities can be mixed and matched within a single dashboard instance.
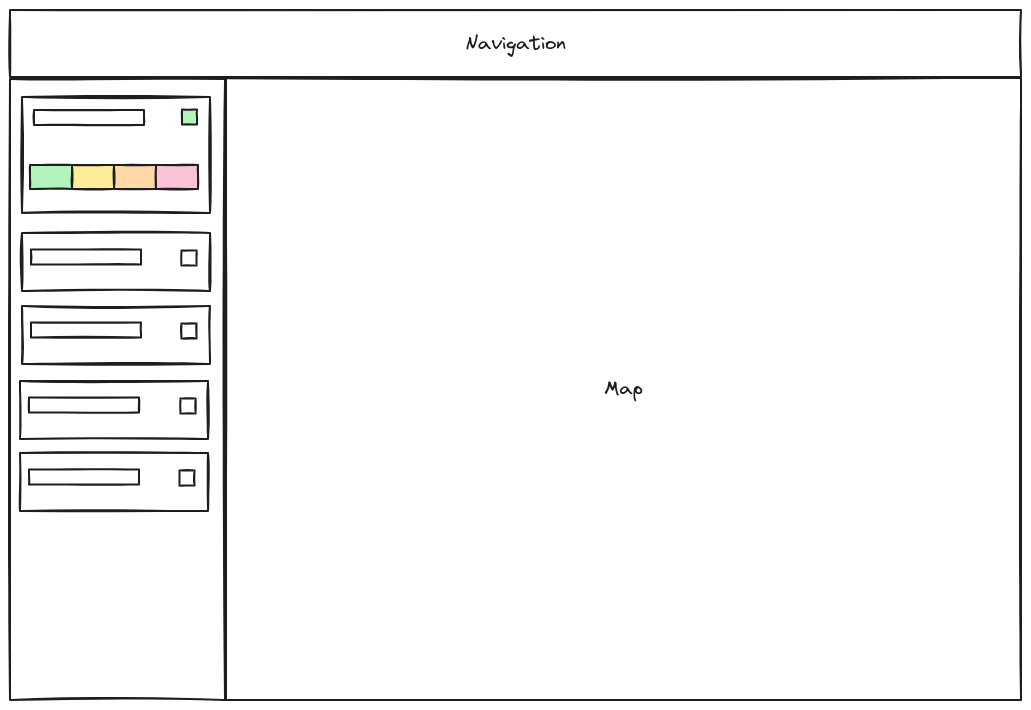
1.2.1 Data Visualization/Exploration (Low Curation)
Features:
- Map with Sidebar layout
- Multiple data layers
- Selectable/toggleable “layer cards”
- Limited layer information on activation
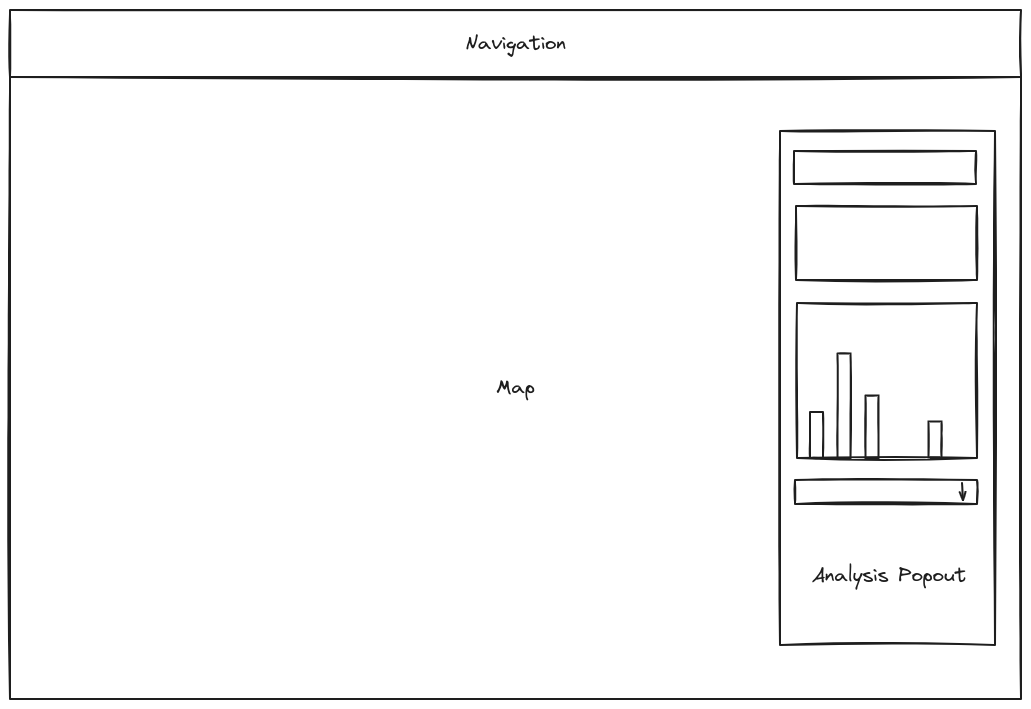
1.2.2 Data Analysis (Medium Curation)
Features:
- Full-screen map with popout OR map & sidebar layout
- Focussed set of data/layers
- Selectable/Toggleable (Optionally)
- Sidebar/Popouts with extra layer details, such as:
- Charts
- Data/Time Filtering
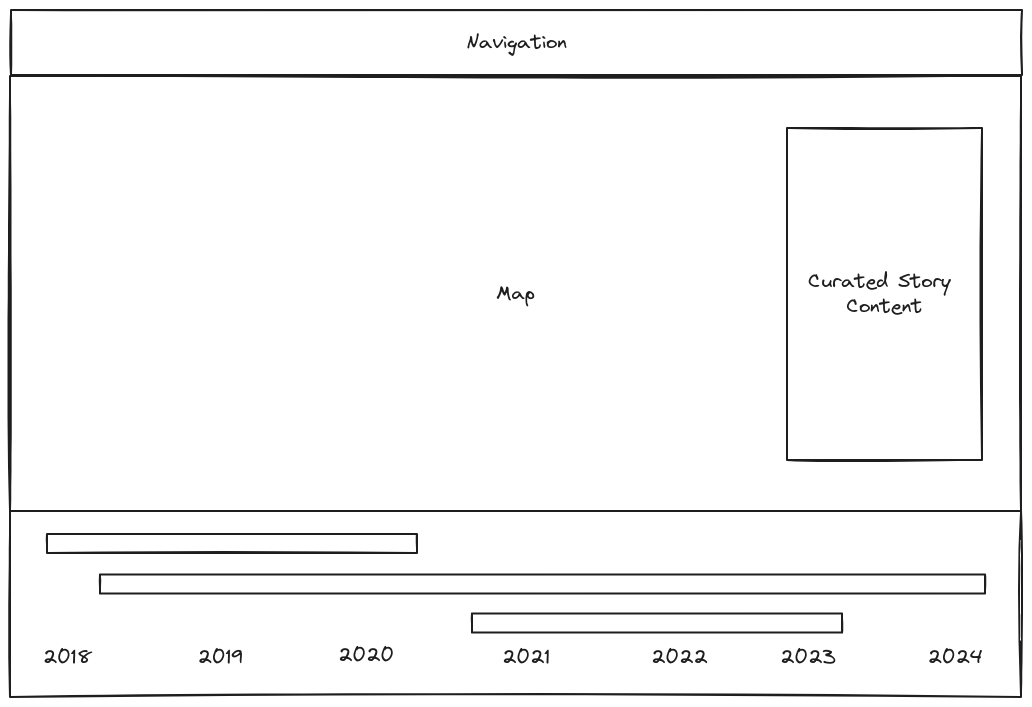
1.2.3 Timeline (High Curation)
Features:
- Map with timeline controls
- Constrained to specific data/areas
- Popout/Sidebar with static content
1.3 Business model
1.4 Technical Architecture

The infrastructure requirements for the dashboards are ultimately quite simple as the majority of this APEx component exists client side using the React framework. Infrastructure needs for the dashboards are:
- Cluster Ingress: External traffic will need to be routed to the dashboard web service. This will either need to be based on a: domain, subdomain or path basis.
- Namespace: Projects could have a unique namespace for isolation purposes.
- Web Service: One or more pods will run a simple web server to provide users with requested resources from the file service. This web service can be built using either:
- Nginx
- Node.js
- FastAPI
- Web Service: One or more pods will run a simple web server to provide users with requested resources from the file service. This web service can be built using either:
- File Service: Storage for assets and configuration, these will be both generic and project based. Generic files are for use in every instantiated project and would include the React bundle and any generic HTML documents, whereas the project-based files would include the dashboard configuration and project assets for use in branding for example.
It is important to highlight that the complexity of the required web server and the technology it uses is dependent on further requirement gathering and architectural decisions.
1.5 Operational Management
The dashboard service should be relatively low maintenance regarding infrastructure and monitoring once the dashboard is instantiated successfully.
Depending on the architecture of the infrastructure used for the dashboard service scaling will be mostly dependent on traffic levels to the web service hosting it. If using a Kubernetes-based infrastructure the scaling would be managed by the cluster based on available resources for the pod.
The use of an analytics platform/framework would be useful for monitoring front-end health. The only concern for monitoring on the front end would be to verify that all calls to third-party data sources are correctly responding. Maintaining these data sources is, however, out of the scope of responsibility for the dashboard service.